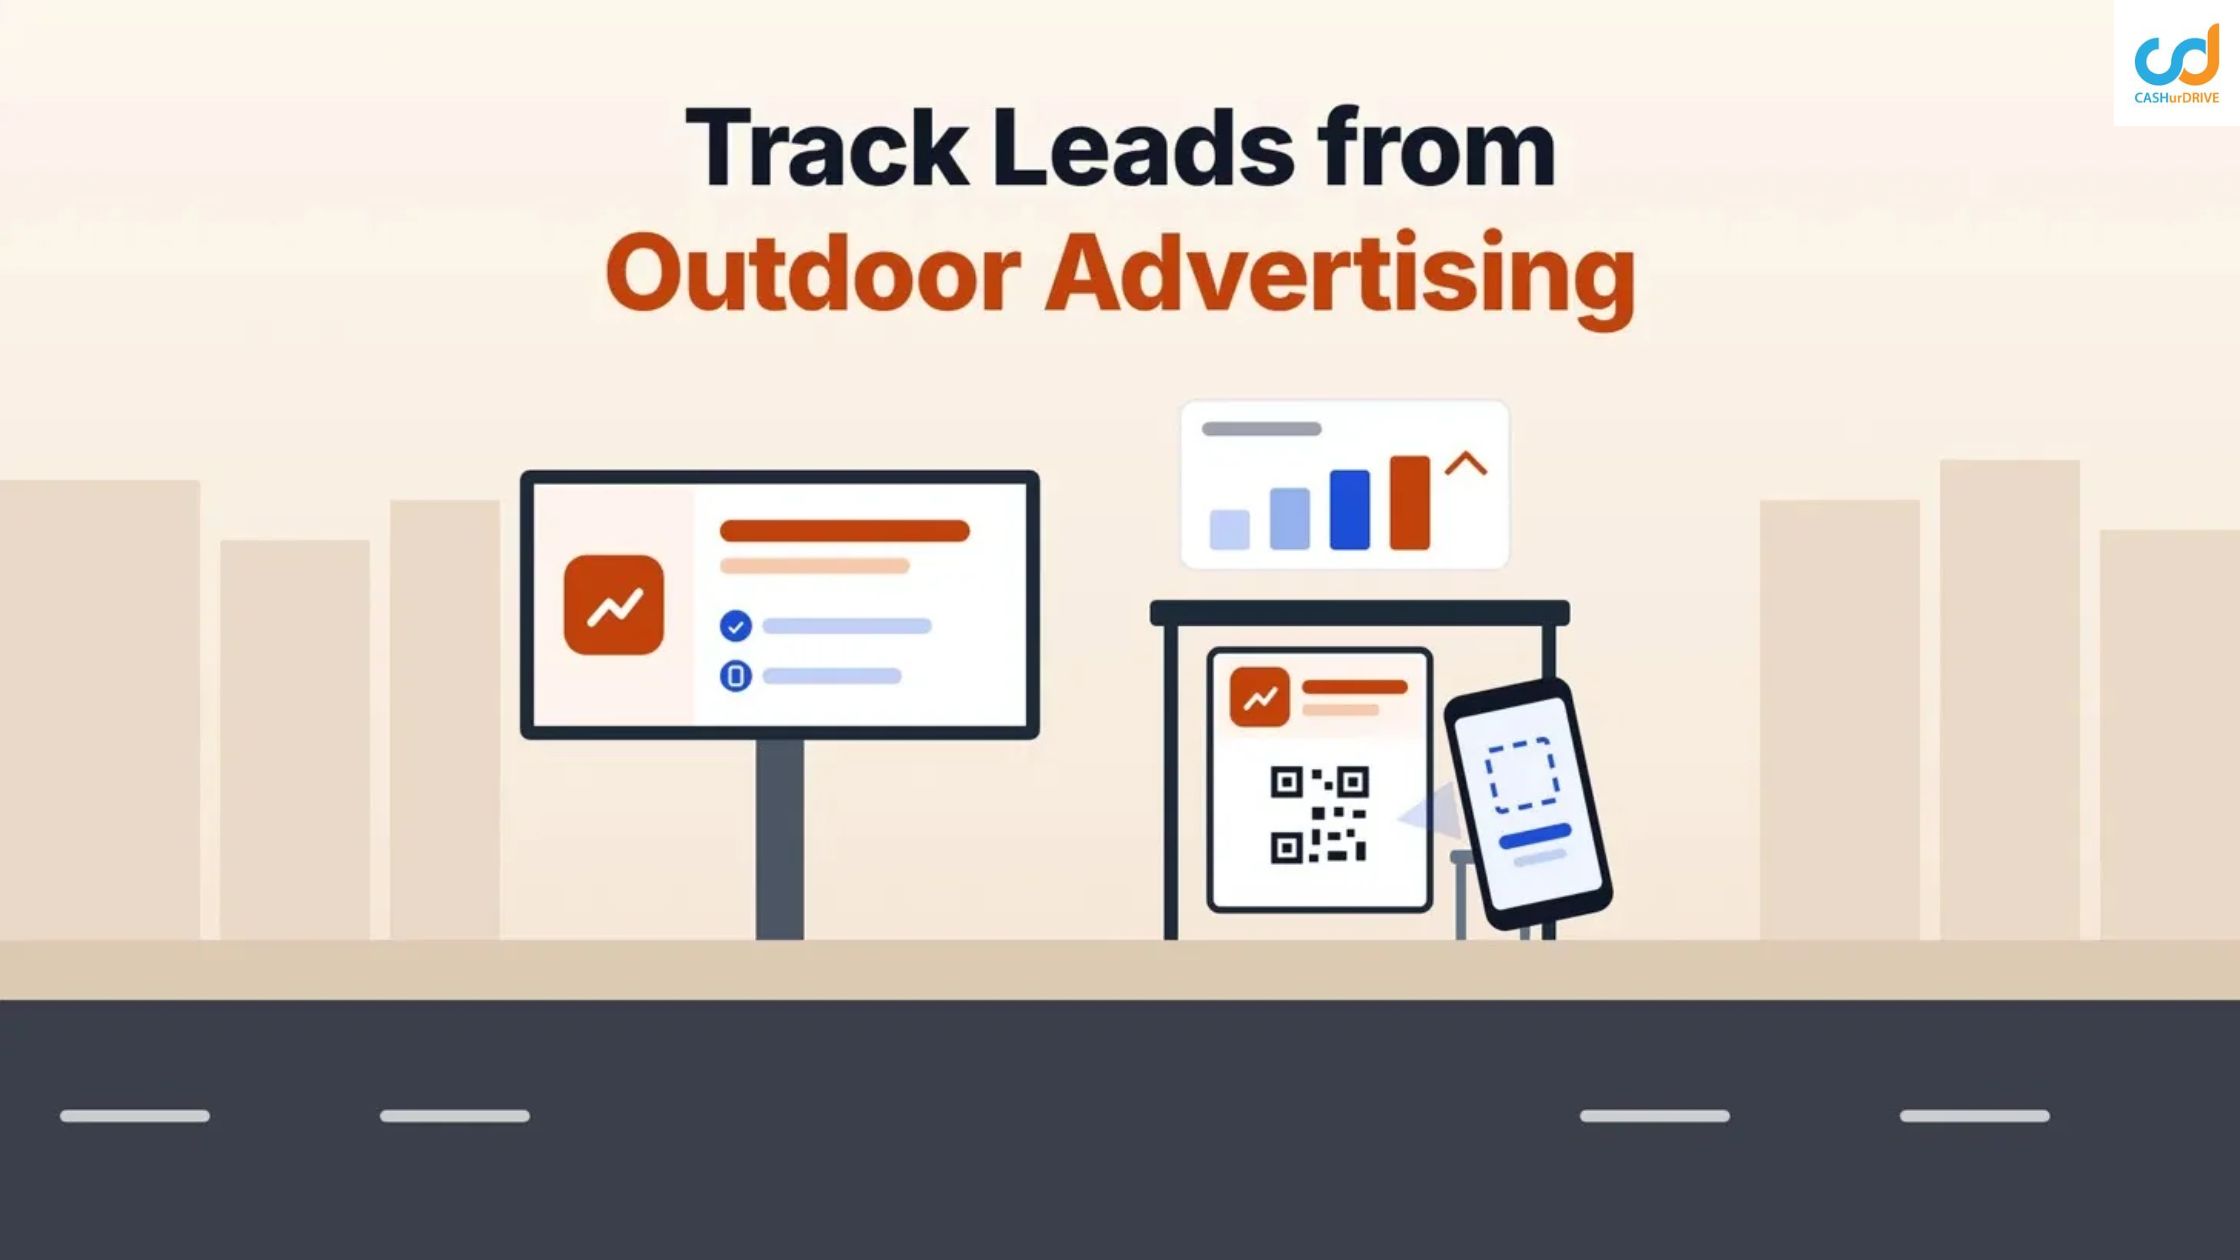
Are You Tracking the Right Results from Your Outdoor Advertising Campaign?
 By Annu
The campaign has ended, and the finance team asks a simple question: what did the hoardings bring in? Often the only answer is “enquiries went up”. That answer is hard to defend, because the tracking was never planned. No brand can track leads from outdoor advertising perfectly, because many people see an ad, remember it and act days later through another channel. You can, however, track the right results, if you decide what to measure before launch and report each result at the level of certainty it supports.
Decide what “results” means before the campaign starts
Not every outdoor campaign should be judged on leads. An awareness campaign judged only on QR scans will look like a failure, even when it did its job. To measure OOH campaign results fairly, first match the metric to the objective.
- Awareness or a launch: measure the change in brand interest, for example through branded search, regional search interest or a recall survey.
- Footfall to stores or branches: use store visit tracking after OOH, comparing visits or sales in covered areas with those elsewhere.
- Leads or enquiries: count responses you can trace, such as dedicated URLs, numbers and offer codes.
Once the objective is clear, then choose two or three signals that fit it. A plan to track leads from outdoor advertising should name those signals, where each appears and who records them.
Three levels of evidence: direct, correlated and tested
Every outdoor result falls into one of three levels. Keep them separate, though, because each proves something different.
- Direct response. Here, someone uses a signal that appears only on the outdoor ad, such as a short URL, a QR code, a dedicated number or an offer code. As a result, it shows that the ad prompted some people to act. However, it undercounts, because many people act later without using the signal.
- Correlated signals. Here, brand search, enquiries or footfall rise in the period or areas where the campaign ran. Therefore, it suggests an effect, but it does not prove one, since offers, digital ads, seasons and sales teams can move the same numbers.
- Tested lift. Here, you compare areas with the campaign against similar areas without it. For this reason, it is the closest outdoor measurement to cause and effect, although it still gives an estimate, not an exact figure.
In short, direct response shows that some people acted, correlated signals show patterns, and tested lift estimates impact. Keeping these levels apart is the first step if you want to track leads from outdoor advertising credibly.
Direct-response signals that help you track leads from outdoor advertising
Direct signals are the simplest way to track leads from outdoor advertising, provided each one is unique to the campaign, and ideally to the format or city.
- Short, unique URLs. First, use a short web address that appears only on outdoor creatives, and tag it with UTM parameters so it shows up separately in analytics.
- Dynamic QR codes. Also, link each code to a tracked page, and use a different code for each format or city.
- Dedicated phone or missed-call numbers. Similarly, a separate number for outdoor lets the sales team count calls directly. Missed-call numbers are familiar to many Indian consumers.
- WhatsApp click-to-chat links. A QR code or short link that opens a WhatsApp chat with a pre-filled message, such as a city or campaign tag, makes the source visible in each conversation.
- Campaign-specific offer codes. Likewise, a code printed only on outdoor ads shows up at checkout or the counter.
- A source question. Finally, ask “Where did you hear about us?” at the store, branch or sales desk, and record the answer in your CRM.
Which signals suit which formats
Not every signal suits every format, though, because viewing time and distance decide what people can use.
|
Format |
Signals that work | Avoid or limit |
|
Roadside hoarding or unipole |
Very short URL, easy number or WhatsApp, searchable name | QR codes and offer codes |
|
Bus shelter, metro panel or mall media |
Any of the four signals |
None |
| Bus, cab or auto branding | A short number or WhatsApp link |
QR codes; long URLs or codes |
| DOOH screen | Short URL, number, offer code; QR where people stand nearby |
QR codes seen only from traffic |
Above all, the roadside rule matters. Experienced billboard designers advise against QR codes on highway billboards, because they invite drivers to reach for their phones. Therefore, keep QR codes for formats where people wait or walk, and use a short URL, a memorable number or a searchable name on roadside sites. For more, see how the main outdoor advertising formats differ, including DOOH screens.
Correlated signals: brand search, regional interest and enquiry geography
Instead of scanning anything, many people search for the brand later. As a result, you cannot track leads from outdoor advertising through direct response alone. So, watch these signals during and after the campaign.
- Branded search. Google Search Console now has a branded queries filter that separates branded from non-branded queries. It is available for eligible top-level properties. Then compare branded clicks and impressions before and during the campaign.
- Regional search interest. Similarly, Google Trends shows relative interest by region, which helps you compare covered and uncovered cities.
- Enquiry and footfall geography. Also compare enquiries, visits or sales by pincode, branch or city in covered areas with those in other areas.
However, treat all of these as correlation, not outdoor advertising attribution. A rise during the campaign is encouraging, but other activities may explain part of it. To get closer to impact, you need a comparison area.
Measuring lift with test and control areas
Of the three levels, a test-and-control design is the most reliable way to estimate what outdoor added. Google researchers describe geo experiments, in which separate regions are assigned to test or control groups. Later work also covers matched-market tests that compare a single test region with a single control region.
For an outdoor campaign, the practical version looks like this:
- Choose similar areas. First, pick a test area and a control area with similar size, customers and past sales trends.
- Set a baseline. Next, record the same metrics in both areas for several weeks before launch.
- Keep other activities equal. Then run the same digital ads, offers and sales effort in both areas, so outdoor is the main difference.
- Run the campaign in the test area only. Afterwards, compare how each area changed against its own baseline.
- Allow enough time. Finally, measure long enough to cover the normal buying cycle, plus a short period after the campaign ends.
As a result, you measure the change in the test area beyond the change in the control area, not just the total.
Hypothetical: a two-city appliance retailer test
HYPOTHETICAL AND ILLUSTRATIVE. A regional appliance retailer runs outdoor ads in City A and none in City B. Both cities have similar stores and, importantly, similar past sales.
During a four-week baseline, City A averages 400 enquiries a week and City B averages 380. Over the campaign, City A rises to 480, a 20% increase. City B also rises, to 418, a 10% increase, because of a seasonal sale running in both cities.
A raw reading would credit outdoor with the full 20%. By contrast, a test-and-control reading credits it with roughly the extra 10 percentage points above the control, or about 40 enquiries a week. Meanwhile, the outdoor-only WhatsApp link and number recorded 35 enquiries a week. However, these figures measure different things and may overlap, so do not add them together or compare them directly. In other words, brands that track leads from outdoor advertising only through direct signals see just part of the picture.
These numbers are invented; real results will vary.
A pre-launch tracking checklist
Before the first site goes live, check that your plan to track leads from outdoor advertising covers these basics:
- each format and city has its own URL, QR code, number or WhatsApp link;
- QR codes appear only on dwell formats and are test-scanned at real viewing distance;
- UTM tags and CRM source fields are set up and tested;
- staff ask, and record, where each customer heard about you;
- baseline data for branded search, enquiries and footfall covers several weeks;
- a control area is chosen, if you plan to measure lift;
- your media partner can confirm whether it provides dated site photos and monitoring reports;
- The reporting format is agreed, with direct, correlated and tested results shown separately.
See also how to verify an outdoor advertising site and how to compare outdoor advertising quotes.
Reporting results honestly
A good report shows three things. First, the direct responses, with their counts. Second, the correlated signals, labelled as correlation. Third, any test-and-control estimate, with its comparison area and time frame. It should also state what the data cannot show.
Finally, note that industry audience data is different. India’s OOH industry is building audience measurement for planning and buying, such as the IOAA-backed RoadStar platform. It estimates who could see a site; it does not track your leads.
Build measurement into the plan
In short, the brands that track leads from outdoor advertising well decide on the metric first, choose signals that fit each format, and keep direct, correlated and tested results apart. If you are planning a campaign, you can request an indicative media plan, location recommendations or format guidance from CashUrDrive. Then agree how results will be measured before launch.
Frequently asked questions
Q1: Can you measure outdoor advertising ROI exactly?
No. Direct signals undercount, while correlated signals can include other effects. A test-and-control design gives a reasonable estimate, not an exact figure, so report it as an estimate.
Q2: Should every outdoor ad have a QR code?
No. Instead, QR codes suit bus shelters, metro panels, malls and screens where people stand nearby. On highway hoardings and moving vehicles, use a short URL, a memorable number or a searchable name instead.
Q3: How does mobile-location (geofence) attribution work, and what should I ask a vendor?
These tools estimate how many mobile devices detected near an ad site later visited a physical store or other defined location. Results depend on the data source, sample and comparison group. Ask the vendor where the location data comes from and how consent is handled; how exposure and visits are defined; what the comparison group is; and whether results have been independently checked.
Q4: Does a rise in branded search prove outdoor worked?
Not on its own. It is useful, but other activity can drive it too. Compare it with a control area, or with the period before the campaign, before drawing conclusions.